Tampilkan postingan dengan label Opini. Tampilkan semua postingan

Minggu, 01 Januari 2012

Reaction Paper: Statistical thinking and its role for industrial engineers and managers in the 21st century

Article entitled ‘Statistical thinking and its role for industrial engineers and managers in the 21st century’ written by Miltiadis Makrymichalos as a managerial audit journal is a very relevant article to the present situation. Nowadays, most of the managers do not use a statistical way of thinking in making decisions. Despite that many managers use six sigma to improve their business processes, they did not think statistically. I think the statistic is not just a tool, but it was also a basic principle about how to think logically and systematically.

The managers only use statistics as a tool when they encounter a problem which is related to data. In my opinion, the managers did not use the statistical thinking because of the difficulty in understanding the statistics principles. Furthermore, they have variety in educational backgrounds. Once they have found an issue or a problem, they will solve it according to their past experience and their knowledge. But when they did meet a problem that generates lot of numerical data, they used the statistics method.

According to the article, make decisions with statistical thinking means that the managers have to think the problem as a system as it is explained in the article that ‘All work is a system of interconnected processes'. The managers have to be able to see the variety of any situations and outcomes in any system. Therefore they will be able to analyze or even predict the upcoming situations and outcome of a problem.

For example, if we use six sigma we can solve the problem systematically. In the real situation, the managers only use six sigma or other tools as a means to repair. But they did not understand the basic principle or the essence of the six sigma method. In a research and development of the manufacturing, most of managers and engineers are focus on clients more than their own organization. Furthermore, the managers are also use the practical data to solve the problem. This way of thinking will led to an ineffective decision. The statistical thinking will first lead the managers to see the symptoms and any variation on a business process problem first. Statistical Thinking and its principles are not difficult and does not actually need to be profound. But it must be known by the managers. Therefore, when they using tools such as QFD, DOE, Six Sigma, and Pareto charts they will be able to predict where the outcome has risen.

In conclusion, I feel devastated because of many managers and engineers are ignoring the statistical thinking. But luckily, this paper summarizes the circumstances that existed at the moment. Not just as a warning, this topic can be a wakeup call to many managers that statistics is not just a daunting and meticulous method, but can be a useful way of thinking to the business in any industry.

Selasa, 10 Mei 2011

I HATE STATISTICS

Just try to google "I hate Statistics", surprisingly there's a huge of it. Apparently, statistics  is so popular (lol). There's even a group on facebook named I HATE STATISTICS. Wow!
Let's take a look why those people do so.

 Jovan
I, for one, hate statistics for the following reasons:
- It’s pseudomathematics. It dresses up as a concise set of theories and methods, when these would more properly be referred to as cookbooks.
- It’s simplistic. It gives a false sense of understanding about complex systems where no understanding exists. It prevents people from searching for mechanistic explanations that could indeed provide valuable insights.
- It’s self-adulatory. Its practitioners have the courage to call every little possible way to plot data a “tool” or a “method”.
- It’s too widespread. Most college programs that lack the most basic mathematics have their statistics courses (humanities and sciences), which helps spread misconceptions and misuse.
 (http://flowingdata.com)

Lil_Fig_Newton
So sleepy... three more chapters to read... I HATE stats. WORST SUBJECT EVER! Why oh why did I choose to take it the last semester of my senior year??? Who gives a shit about the null hypothesis???

I'm cycling between extreme bouts of sleepiness and horrible anxiety about my exam, which is in 4 hours (holy fuck, how did time go by so fast?!?!) I need to make a 66 on the final to pass. Please cross your fingers, say prayers, or what ever thing you do for good luck. I have to pass this class to graduate and it is my next to last final. OK, must study more now. More info to CRAM into my exhausted brain.
(http://www.atforumz.com)

Paul Dalton
 There- do you understand? I don’t for what it is worth, but I accept that it is true. I have to do that a lot in my work. I have never been really good with math, yet my work requires looking at statistics. Concepts like confidence intervals and power equations are beyond my ability to truly understand- but I look at them and use them in my work all the time. Is that a weakness for me as an treatment activist- probably.
And that is why I hate statistics.
(http://blogs.poz.com)

Deb
I agree that most people think the field should be renamed "sadistics" but I am not 100% sure why it's so despised.
(http://www.stat.columbia.edu)


Cheryl 
Statistics does suck. It is useless garbage that I will NEVER use. I am 54 years old and I have NEVER used it at work or even running my own business for 18+ years, so what the hell do I need if for now? I have to take it to graduate with my degree.
I bore two boys, raised them, I have undergone open heart surgery and I have NEVER experienced the level of frustration and pain as I have had in this statistics class.
The textbook is POORLY written and the online venue? DON’T have anything to do with Pearson!
I would rather eat glass, drive a pencil through my eye AND walk on coals then to put up with this crap.
There has been nothing my whole life, that could not be figured out by using just addtion, subtraction, multiplying and dividing. The plus? No STUPID rules, that if this happens, then use this or if there is this do this. PLAAEEEEZE! Who thought this junk up????
(http://flowingdata.com)


Patrick 
I hate statistics for a number of reasons:
- My intro professor was without a doubt the worst professor I have ever had. This was essentially intro to statistics for non-statisticians and she took powerpoint slides right from the textbook and threw them up on a screen. Needless to say, it was absolutely useless. Then, during the lab session, she was trying to teach us R without giving us a good background on the concepts. Thankfully, I found a book that barely got me through the class and gave me a great appreciation for some of the concepts. The worst professors are those who lecture for 90 minutes, then say “Any questions.” At which point you don’t even know where to start because s/he lost you in minute two and didn’t care. This was stats for me.
(http://flowingdata.com)


actually all of my CS professors were pretty dynamic. It’s the projects I didn’t like :)
(http://flowingdata.com)


Steve
I may have mentioned it before, but statistics is the worst subject ever to be inflicted on a student. It's even worse than maths.
(http://thedeskinthecorner.blogspot.com)

~Alison
I'm half way thru my online statistics course & I too hate it. It makes no sense to me. i can do the work & give them an answer, but I'm not really learning it. Thankfully only 2 tests left.
It does really stink though. It's confusing to me. Maybe taking it online was not a good idea. it might hve made more sense if I had a teacher lecturing on the material.
(http://allnurses.com)

Jon Peltier
I don’t think people dislike statistics because they are bad at math (though they may be bad at math).
I don’t think the uncertainty is the reason, or the order it imposes.
I think the major reason people dislike statistics is that it was poorly taught in whatever classes they took. Perhaps the instructor didn’t get it, or didn’t do the examples well.
A related reason that people don’t like statistics is that any examples they ever saw were not relevant to something they understood or cared about.
I wasn’t wild about the classroom statistics I had, but what I’ve learned since then has been interesting.
(http://flowingdata.com)

Tony
It sucks soo bad. I get headaches doing this crap (http://amplicate.com/hate/statistics)

So, why do you think you should love statistics? :D 


Kamis, 05 Mei 2011

Statistika : Kesederhanaan yang dapat membangun sebuah keputusan yang tepat


 By: Daniel Agustinus Nababan


Pendahuluan
Fenomena berpikir tanpa berpikir atau yang lebih dikenal dengan BLINK sangat marak di dunia pemasaran. Pemasar mulai mencari insight yang membantu mereka dalam membentuk sebuah keputusan yang tepat untuk memecahkan masalah di dunia pemasaran. Decision Support System yang harus dimiliki pemasar harus benar-benar lengkap dan integrated system. Decision Support System itu tidak harus sampai kepada informasi intelligence tapi cukup hanya dalam ranah data sederhana dengan tampilan yang sederhana-pun, data itu mampu berbicara banyak dan merangsang pemasar untuk menjadikan sebuah program yang sukses dan berkelanjutan.
Malcolm Galdwell dalam bukunya mengatakan bahwa kita perlu 10,000 hours untuk menjadi seorang ahli. Tapi bukan hanya semata-mata menghabiskan 10,000 jam tapi tidak melakukan apa-apa. Tapi bekerja dengan sekeras mungkin. Di dalam bekerja sekeras mungkin itu (extremely worked hard), itulah akan muncul sebuah tingkat intelegensi yang dapat memadukan beberapa data sederhana menjadi sebuah pengetahuan yang dapat ditindaklanjuti.

Statistika dan Statistik


Ketika mendengar kata statistik, orang-orang pasti akan cenderung berpendapat negative dibandingkan dengan pendapat positif. Statistik memang lebih dekat kepada sebuah kelompok data yang ribet, berupa baris dan kolom, deretan dan susunan angka-angka bahkan dengan kata “menyusahkan”-pun sangat dekat. Tapi di balik itu, apa yang bisa kita dapatkan dari statistik itu?
Wikipedia menjelaskan bahwa statistik adalah data, informasi, atau hasil penerapan algoritma statistika pada suatu data. Sedangkan ilmu yang mempelajarinya adalah Statistika. Salah satu alat yang paling sederhana dalam tehnik analisis statistik adalah analisis deskriptif.
Tehnik analisis statistik deskriptif adalah metode-metode yang berkaitan dengan pengumpulan dan penyajian suatu gugus data sehingga memberikan informasi yang berguna. Contoh statistika deskriptif yang sering muncul adalah, tabel, diagram, grafik, dan besaran-besaran lain. Dengan Statistika deskriptif, kumpulan data yang diperoleh akan tersaji dengan ringkas dan rapi serta dapat memberikan informasi inti dari kumpulan data yang ada.
Hal inti menjadi sorotan utama dari statistika deskriptif. Bagaimana inti dari kumpulan data yang diambil menjadi sebuah system yang dapat mendukung kita dalam mengambil sebuah kesimpulan. Tabel, diagram dan grafik tidak menjadi bentuk transformasi dari tabulasi-tabulasi dan deret angka-angka yang ditampilkan dari analisis statistic yang dilakukan melalui software-software statistik yang ada.
Ada beberapa hal yang perlu diperhatikan dalam transformasi data :
1.Transformasi yang dimaksud mencitrakan angka dan data yang benar dan ada.
2.Transformasi yang ditampilkan dapat meringkas dan berbicara lebih cepat.
3.Transformasi yang terbentuk mempercepat kita memahami karakteristik yang terpola.
4.Transformasi yang diwujudkan merangsang kita untuk lebih mengerti.
Dari keempat hal itulah akan muncul sebuah BLINK yang menjadikan statistic itu berdaya guna dan dapat ditindaklanjuti. Kenyataan bahwa statistik yang sederhana itu semakin terwujud ketika grafik dan diagram itu menceritakan gejala dan karakteristik yang ada.


Kesederhanaan yang dapat membangun sebuah keputusan yang tepat

Melalui data-data dan grafik sederhana dapat muncul sebuah keputusan yang tepat. Bukan harus melalui alat statistic atau metoda analisis yang advance atau inferens bisa muncul keputusan yang tepat. Memang metoda analisis lanjutan tetap dibutuhkan untuk mempelajari lebih dalam, tapi dengan melihat gejala pusat yang tepat, sebenarnya kita bisa membuat keputusan yang tepat dengan tingkat kepercayaan yang kita yakini.
Intinya adalah melihat dengan tepat sesuatu yang tepat. Mencermati statistic yang tepat dengan metoda yang tepat. Bukan semata-mata menampilkan grafik dan table yang hebat, namun bukan menggambarkan karakteristik yang ingin diteliti.
Data atau statistic itu dibutuhkan oleh setiap orang. Dan statistic itu sekarang ada banyak dan berlimpah. Namun, apakah orang sudah menggunakannya dengan tepat? Apakah data yang tepat sudah berdaya guna atau masih menjadi tumpukan file yang hanya menunjukkan kumpulan data saja tanpa didayagunakan? Sesuatu yang besar itu tidak selalu datang dari sesuatu yang besar. Bisa saja dari sebuah hal yang kecil bahkan sederhana. Tapi, jika dengan cara yang tepat mengerjakan dengan tepat apa yang tepat itu akan menjadi besar dan berdayaguna.


Selasa, 26 April 2011

Statistics Can Be Misleading

A very interested information about stats, here is:


Author:  Lori Alden
Audience:  High school and college economics students
Summary:   With this series of 12 puzzles, you can help your students become more discriminating consumers of economic statistics.   
Procedure:  Each of the following problems shows one or more misleading statistics.  See if your students can figure out why they're misleading.
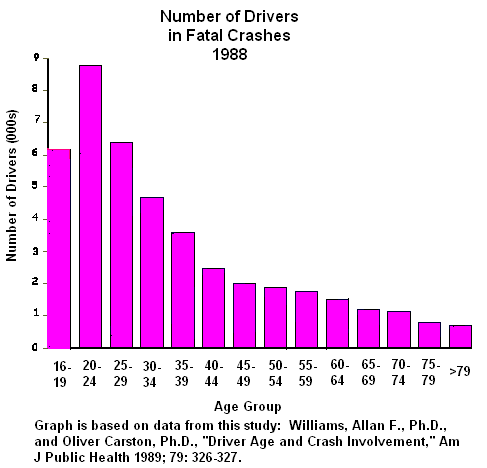
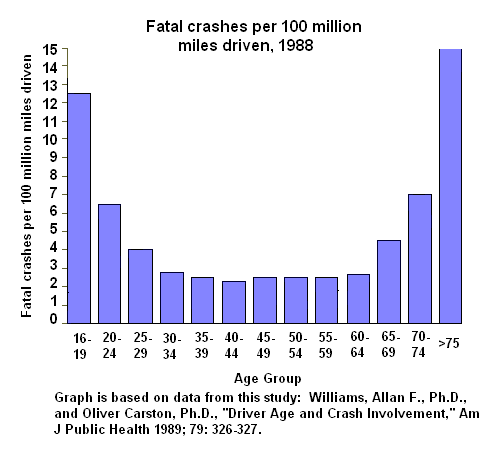
1.  The following statistics suggest that 16-year-olds are safer drivers than people in their twenties, and that octogenarians are very safe.  Is this true?
Solution:  No.  As the following graph shows, the reason 16-year-old and octogenarians appear to be safe drivers is that they don't drive nearly as much as people in other age groups. 

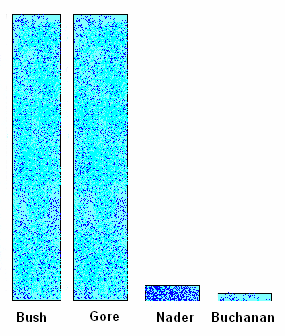
2.  On November 13, 2000, Newsweek published the following poll results:
Since 9% said that Nader was the only candidate worth voting for, one would have expected him to get at least 9% of the vote in the 2000 election.  He only got about 3%.  What happened?
Solution:
There was a biased statistic because the sample wasn't randomly drawn from the population.  A disproportionate number of Nader supporters participated in the poll in order to make him appear more viable as a candidate.
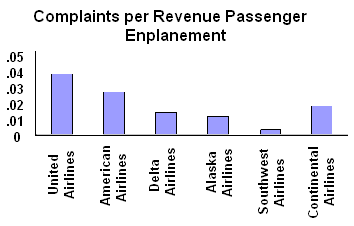
3.  Consider these complaints about airlines published in US News and World Report on February 5, 2001:
Can we conclude that United, American, and Delta are the worst airlines and Alaska, Southwest, and Continental are the best? Solution:  No.  The airlines that had the most complaints also had the most passengers.  As the following graph shows, rates and percentages are often more informative than raw numbers.
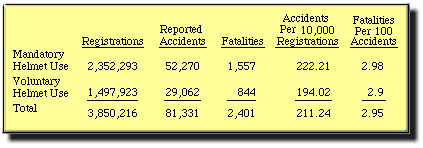
4.  The following statistics about motorcycle helmet use seem to suggest that helmets cause more injuries and fatalities.  Is it really safer to go without helmets?
Source:   Motorcycle Statistical Annual, Motorcycle Industry Council, Inc., 1994, as reported on http://www.bikersrights.com/statistics/stats.html.
Solution:  Correlation doesn't prove causation.  The statistics suggest that helmets cause accidents and fatalities, but it's possible that a high number of motorcycle accidents and fatalities in high-risk states caused them to adopt mandatory helmet laws.  
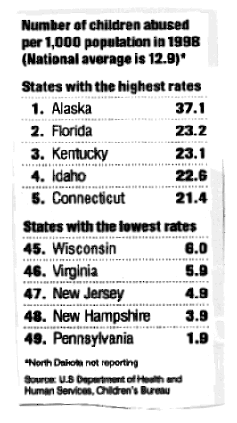
5.  This clipping from US News and World Report on 1/29/01 suggests that Alaskans are terrible parents.  Is this true?
Solution:  The difference in the abuse rates probably stems from different definitions for abuse in the various states.  For example, Alaska (the "worst" state) says that a child is abused if his or her health or welfare is harmed or threatened.  Pennsylvania (the "best" state) defines it as a recent act or failure to act.
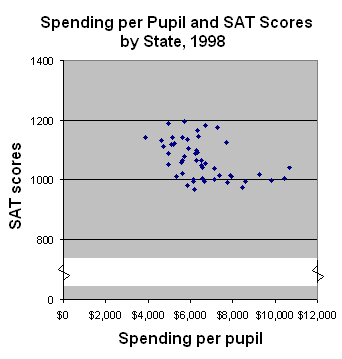
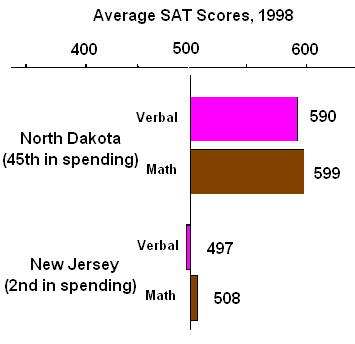
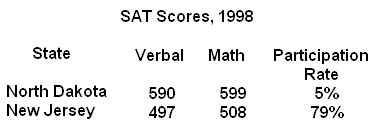
6.  Columnist George Will wrote in the Washington Post in 1993 that  "... the 10 states with the lowest per pupil spending included four — North Dakota, South Dakota, Tennessee, Utah — among the 10 states with the top SAT scores ... New Jersey has the highest per pupil expenditures, an astonishing $10,561… [Its] rank regarding SAT scores? Thirty-ninth." 
This negative correlation between spending per pupil and SAT performance seems to be borne out by this graph:
And by this one:
Does this mean that spending more on education makes students worse off?
Solution:  The results are more likely due to differing SAT participation rates in the states (Colleges in North Dakota and other states require the ACT rather than the SAT for college admissions).  The students who take the SAT in North Dakota include many who plan to apply to elite out-of-state colleges.
This caused a sampling bias, since the sample wasn't representative of the population.
7.   Researchers (Arthur Kellermann et. al., "Gun Ownership as a Risk Factor for Homicide in the Home," The New England Journal of Medicine, October 7, 1993, pp. 1084-1091), found that gun owners are 2.7 times more likely to be murdered than non-owners.  Does this mean it's safer to not have guns in the house?
Solution:  Perhaps, but correlation does not imply causation.  It may be true that guns cause murders, but it might also be true that having a greater risk of being murdered causes people to own guns.
8.  "The best public schools offer a more challenging curriculum than most private schools."  Are public schools therefore better than private schools?
Solution:  We're being asked to compare apples with oranges:  the best public schools versus most private schools.
9.  "Fluoride consumption by human beings increases the general cancer death rate.   ….  [P]eople in fluoridated areas have a higher cancer death rate than those in non-fluoridated areas."  Should fluoridation be prohibited?
Solution:  Affluent areas are more likely to have fluoridation and they're also more likely to have older populations who are more likely to get cancer.
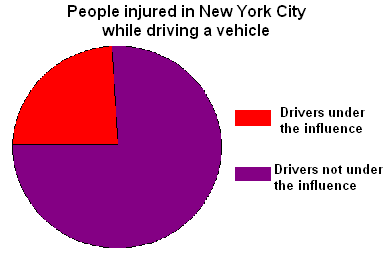
10.  Can we conclude from the following diagram that it's safer to drive while under the influence?
 
Solution:  No.  Drunk drivers have a fatality risk 7.66 times the norm, while non-drunk drivers have a risk only about .6 of the norm.  Only a very small percentage of drivers in New York City drive while under the influence, but they account for a disproportionate number of accidents.
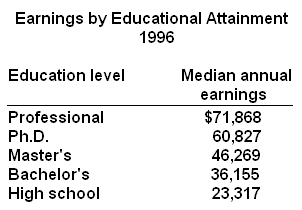
11.  The Monthly Labor Review published the following data, showing how earnings vary with education:
Can we conclude that getting a bachelor's degree will increase your earnings by almost $13,000 a year?
Solution:  Not necessarily.  Intelligence and drive also explain the differences in earnings, people with intelligence and drive are more likely to go to college.
12.  Allen Hershkowitz, senior scientist with the Natural Resources Defense Council, wrote that "a  well-run curbside recycling program can cost anywhere from $50 to more than $150 per ton of materials collected. Typical trash collection and disposal programs, on the other hand, cost anywhere from $70 to more than $200 per ton."  Does recycling save money?
Solution:  Hershkowitz asks us to compare apples with oranges:  a well-run curbside recycling program with typical trash collection and disposal programs.


© Lori Alden, 2005-7.  All rights reserved.  You may download the content, provided you only use the content for your own personal, non-commercial use.  Lori Alden reserves complete title and full intellectual property rights in any content you download from this web site. Except as noted above, any other use, including the reproduction, modification, distribution, transmission, republication, display, or performance, of the content on this site is strictly prohibited.

source: http://www.econoclass.com